Chromium in foods: table values and real portions
Futures Nutrition Editorial Team · 13 August 2026
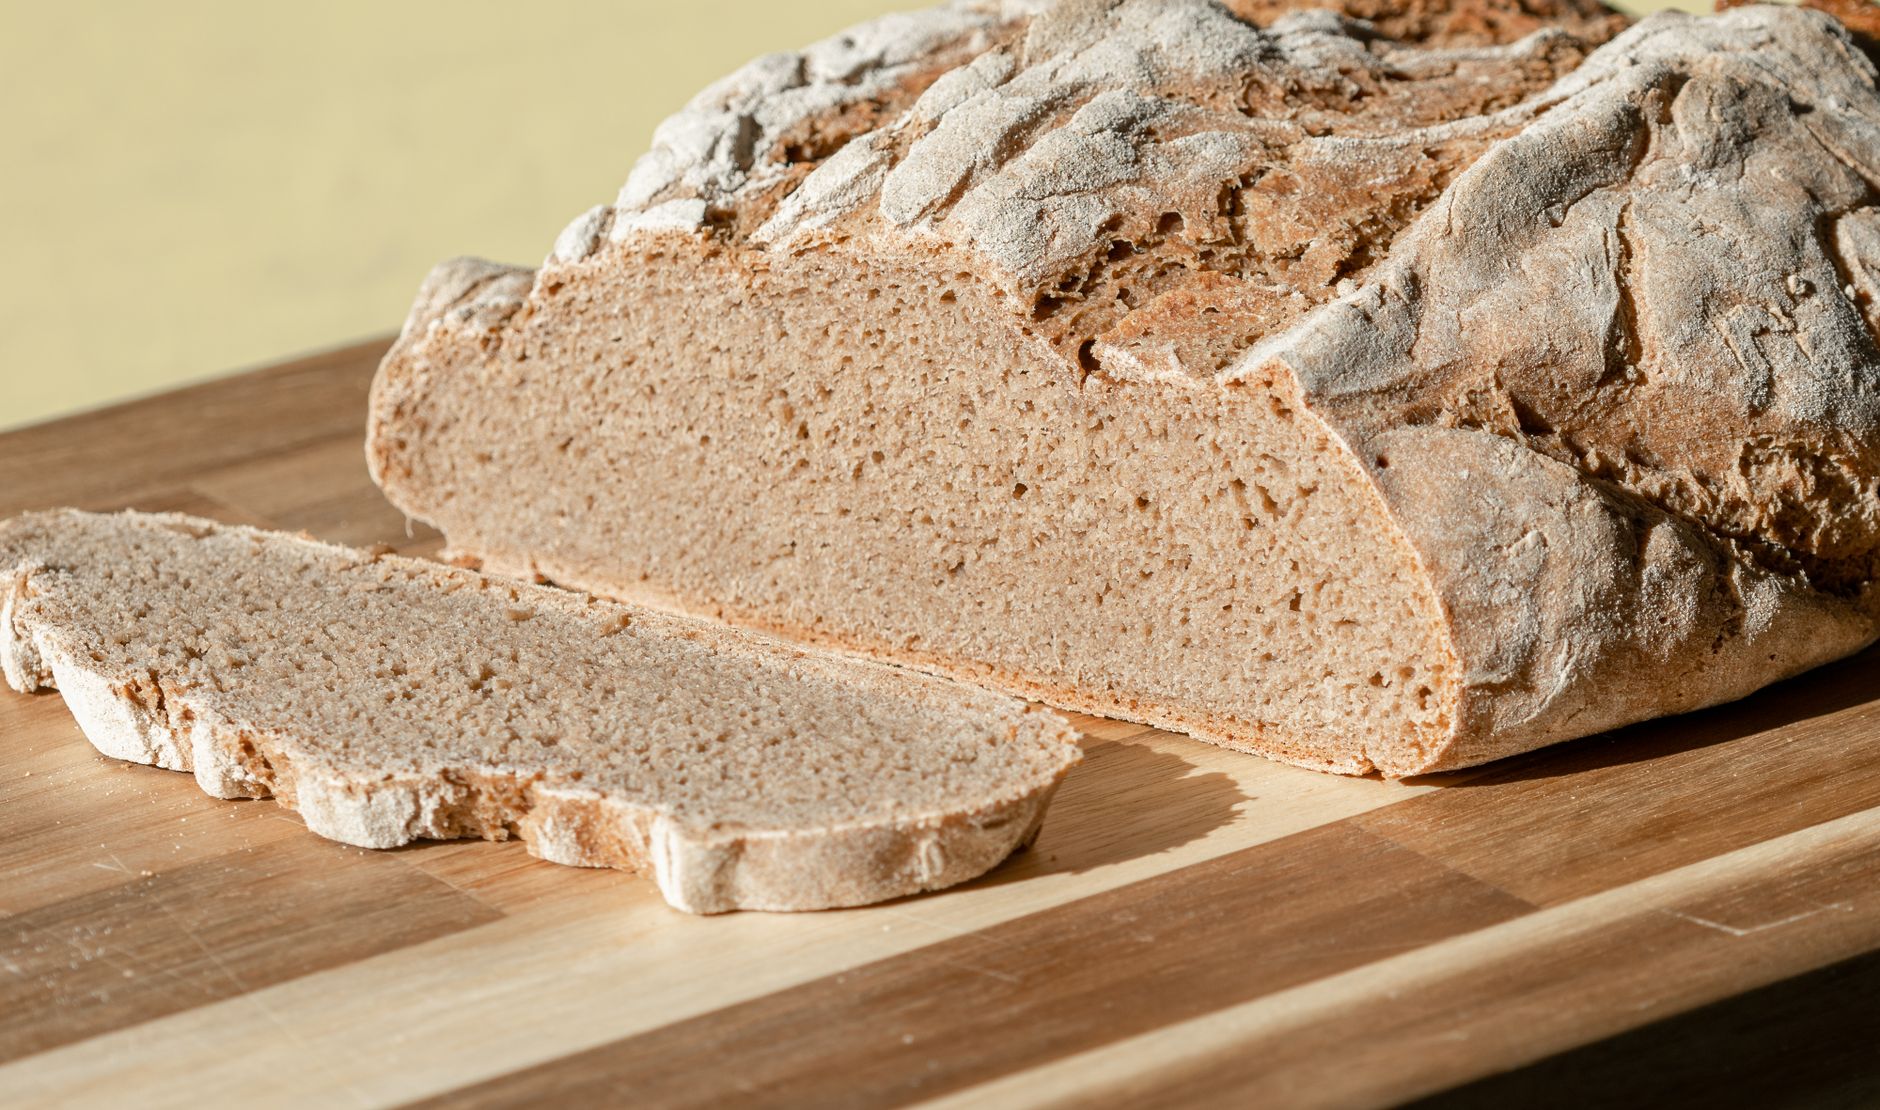
The short answer: a "chromium-rich food" in the proper sense does not exist. According to the European measurement data, broccoli, oats, nuts, meat and bread all deliver the same order of magnitude — around 3 to 12 µg per usual portion. What decides the daily balance is therefore not the one special food but the amount: in Europe the largest single share of chromium intake comes from bread and bakery products, followed by dairy products, beverages and meat.
Anyone searching the web for chromium contents finds lists with remarkably precise figures — and comparing two of those lists turns up differences of five- to tenfold. That is not a transcription error. It is the actual subject of this article.
Why the table values lie so far apart
Chromium is present in foods at very low concentrations, mostly in the range of a few micrograms per kilogram. In the data the European Food Safety Authority (EFSA) collected for its assessment of chromium in food and drinking water, the limits of quantification of the methods used ranged from 0.23 µg/kg (inductively coupled plasma mass spectrometry) to 90 µg/kg (flame atomic absorption). Depending on the laboratory, one and the same food therefore lies clearly above the detection limit in one case and entirely below it in the next.
On top of that comes a second problem, and it arises of all places in the kitchen. The second French total diet study found chromium levels in every food group that were 2.4 to 13 times higher than in the first study — most strongly in fats and oils. The authors explain this by the fact that kitchen equipment and mills made of stainless steel, aluminium and cast iron were used for the second study, and not for the first. Part of the chromium measured therefore came out of the pot and the grinder, not out of the food.
The British total diet study shows the same thing from the other side: in 1997, values from 0.01 mg/kg (milk group) to 0.23 mg/kg (meat products) were reported; in 2006, bread, offal, poultry, beverages and milk were below the limit of detection. The foods had not changed, the analysis had.
For the reader in front of the shelf this means: with chromium, single values from nutrient tables are good for orientation, not for arithmetic. That is also why the German Nutrition Society (DGE) publishes no chromium nutrient table at all, but only names sources — meat, eggs, oats, tomatoes.
What the European measurement data show
The most reliable collection comes from the EFSA panel on contaminants in the food chain: a good 40,000 samples from the member states, evaluated by food group. The figures are given as mean values in a range between "lower bound" and "upper bound" — the two ways of calculating differ in how values below the limit of quantification are handled.
| Food group | Mean (µg/kg) | calculated per 100 g | Samples |
|---|---|---|---|
| Herbs, spices, condiments | 1,627–1,665 | 163–167 µg | 611 |
| Sugar and confectionery | 625–639 | 63–64 µg | 1,126 |
| Vegetables (incl. mushrooms) | 307–319 | 31–32 µg | 4,647 |
| Fats and oils | 263–301 | 26–30 µg | 186 |
| Legumes, nuts, oilseeds | 163–177 | 16–18 µg | 1,167 |
| Grains and grain-based products | 103–135 | 10–14 µg | 3,910 |
| Fish and seafood | 98–109 | 10–11 µg | 1,565 |
| Meat and meat products | 53–64 | 5–6 µg | 2,088 |
| Non-alcoholic beverages | 45–58 | 5–6 µg per 100 ml | 399 |
| Milk and dairy products | 27–55 | 3–6 µg | 608 |
| Potatoes and starchy roots | 29–38 | 3–4 µg | 631 |
| Fruit | 22–39 | 2–4 µg | 1,448 |
| Eggs | 22–29 | 2–3 µg | 80 |
The means do, however, hide the distribution. For vegetables the median lies between 0 and 30 µg/kg — the 307 µg/kg average comes about through a few outliers, among them a single garlic sample at 580 µg/kg and seaweed at 441 µg/kg. Brassica vegetables, and therefore broccoli too, sit at 28–37 µg/kg in the data set. It is similar with the spices: the high figures concern amounts that nobody eats by the portion.
Broccoli, wholegrain, nuts — one after the other
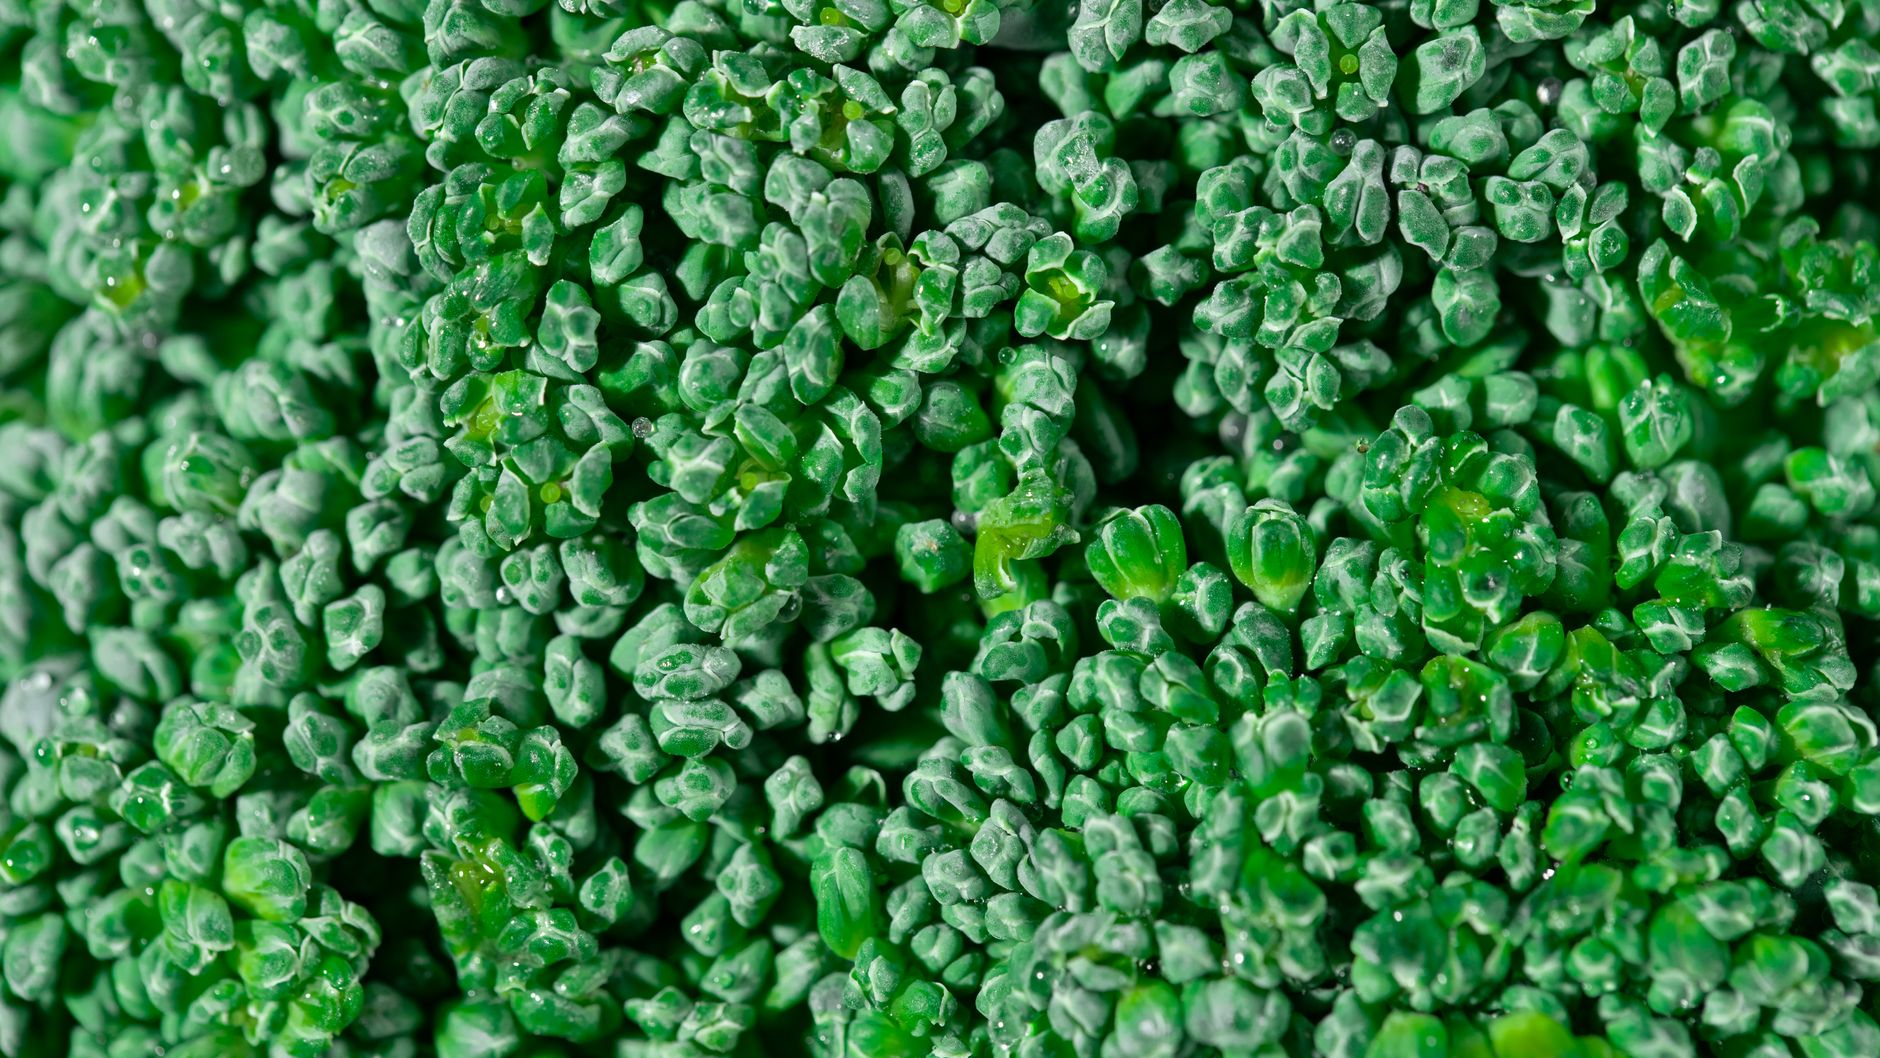
Broccoli owes its reputation to older North American analyses that give double-digit microgram values per half cup. The European data do not support that: at 28–37 µg/kg, a large portion of 200 g contains around 6 µg. A single Hungarian farm sample came in at 119 µg/kg — that would be four times as much, and exactly this scatter is the point.
Wholegrain carries its lead in the data less clearly than the guidebooks promise. Wheat bread and rolls lie at 89–115 µg/kg, multigrain bread by contrast at 30–42 µg/kg, rye bread at 40–46 µg/kg. Among the milling products, oat products stand at the top with 110–140 µg/kg and rye at the bottom with 18–34 µg/kg. That of all things oats stand out fits the oat flakes in the DGE's list of sources.
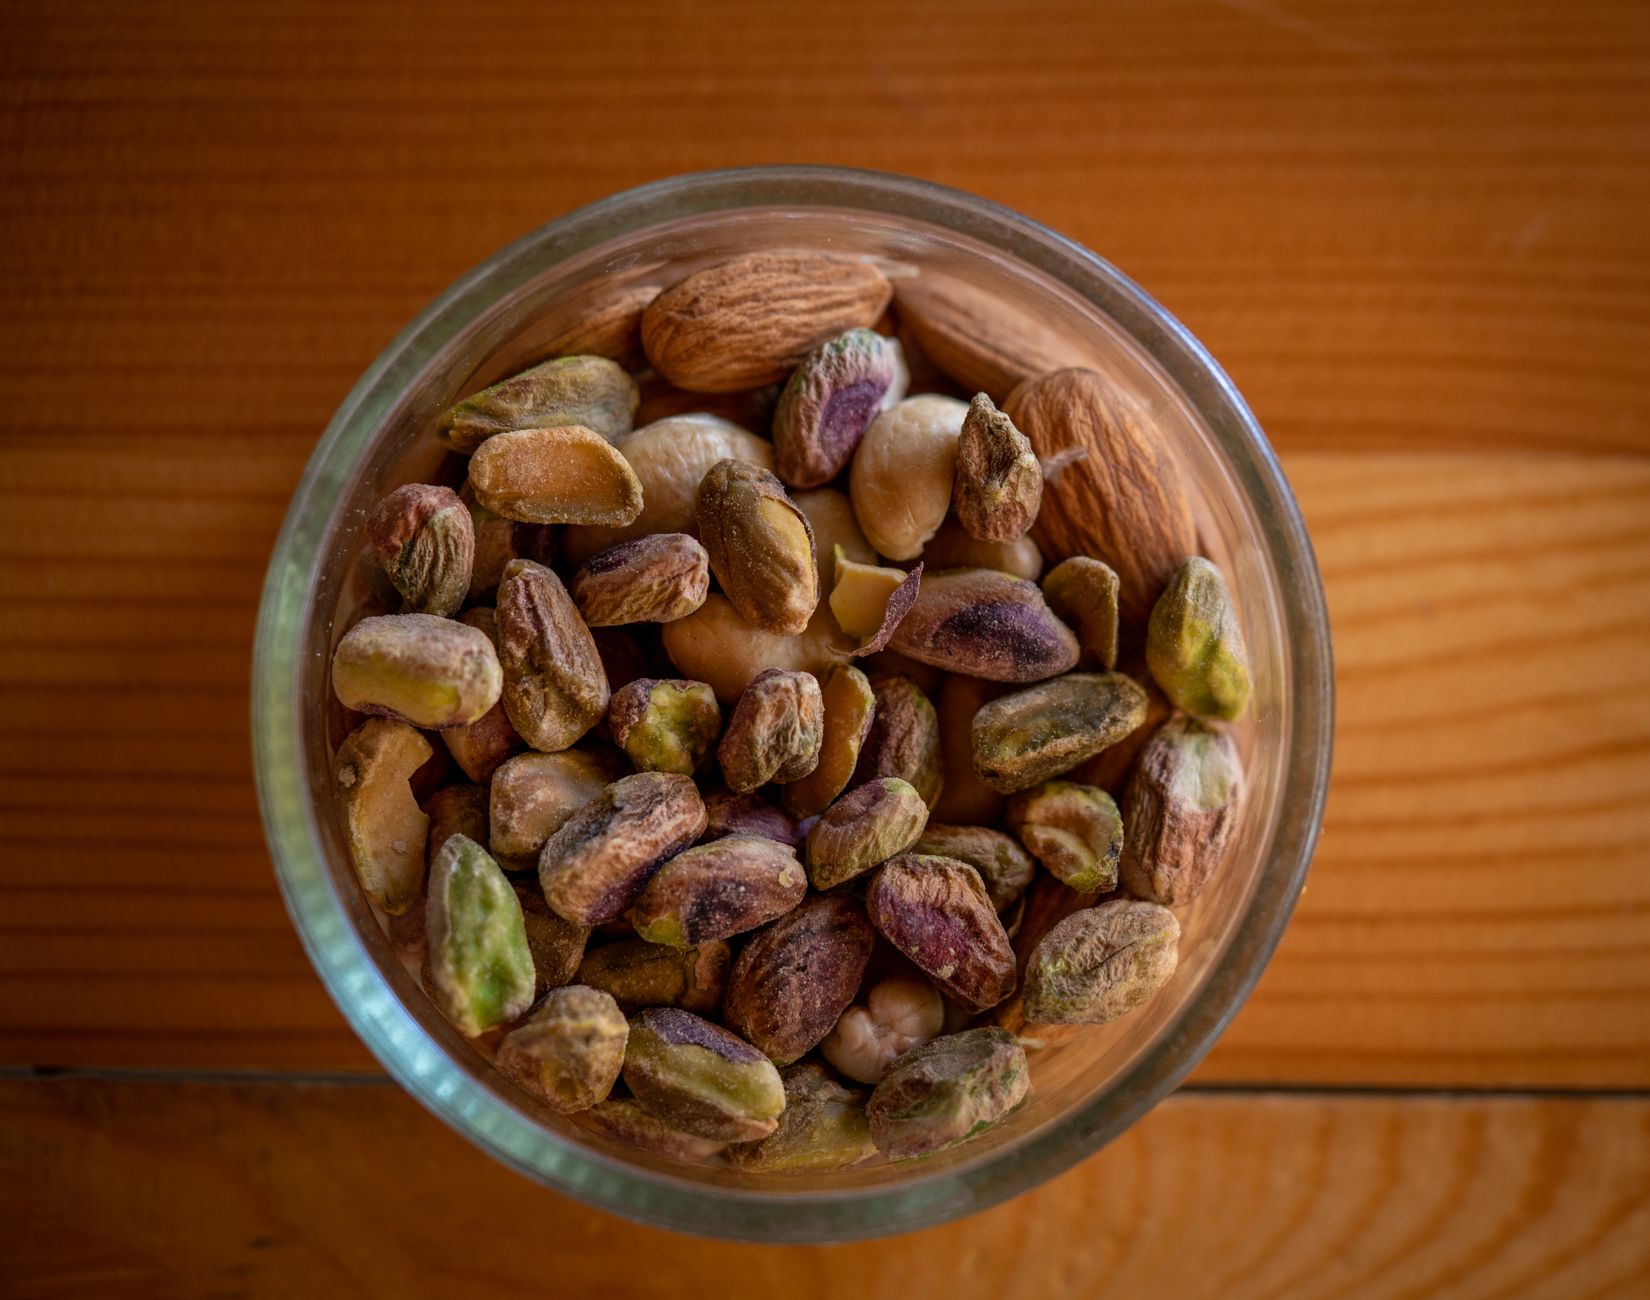
Nuts and oilseeds are indeed substantial per kilogram — tree nuts 175–193 µg/kg, oilseeds 214–227 µg/kg — but the portion is small: 25 g of nuts deliver about 4 to 5 µg. Within the group the variation is wide, with hazelnuts at 102–123 µg/kg and walnuts at 57 µg/kg.
Converted to what actually ends up on the plate:
| Food | usual portion | Chromium per portion |
|---|---|---|
| Cocoa powder | 10 g | approx. 43 µg |
| Milk chocolate | 30 g | approx. 15 µg |
| Wheat bread | 2 slices (100 g) | 9–12 µg |
| Meat | 150 g | 8–10 µg |
| Broccoli, brassica vegetables | 200 g | approx. 6 µg |
| Oat flakes | 50 g | 6–7 µg |
| Nuts | 25 g | 4–5 µg |
| Milk | 200 ml | 3–4 µg |
| Coffee (as drunk) | 200 ml | approx. 2 µg |
Where the intake actually comes from
It is precisely this table that explains why the ranking of chromium sources looks different from the ranking of chromium contents. For adults between 18 and 65 years, the largest contributors to chromium intake were the food groups "bread and rolls" (median 14 %), "milk and dairy products" (8 %), "non-alcoholic beverages" (7 %) and "meat and meat products" (7 %), followed by chocolate products (6 %), vegetables (6 %) and potatoes (5 %).
Two different mechanisms lie behind this. Chocolate and cocoa are on the list because of their high concentration — cocoa powder reaches 4,345 µg/kg in the data set. Bread and milk are there because they are eaten daily and in large amounts, even though their contents are low. With beverages, both come together: the group contains cocoa drinks as well as coffee and tea, whose dry goods carry high values (roasted, ground coffee beans 231 µg/kg; tea leaves 2,527 µg/kg), while only a few µg/kg arrive in the finished infusion.
In sum, the measured intakes land where the German estimated value lies: duplicate studies in Germany measured a mean of 61 ± 31 µg per day in women and 84 ± 55 µg in men; across Europe the medians for adults lay between 57.3 and 83.8 µg per day. The D-A-CH estimated value for adolescents from 15 years and adults is 30 to 100 µg per day. How the µg figure on a pack relates to the reference value of 40 µg, and what else is worth checking before buying, is set out in Buying chromium: µg, form and combination products.
When a supplement is added
In the same data set one group stands out that has nothing to do with normal eating: "products for special nutritional uses" — which includes fortified products and food supplements — averaged 12,129 µg/kg. That is a thousand times the order of magnitude of a vegetable and shows how quickly a preparation dominates the balance.
Our Chromium 200 µg delivers 200 µg of chromium as chromium picolinate per tablet, that is markedly more than a whole day of eating provides through food. That is above the maximum level of 60 µg per recommended daily portion proposed by the German Federal Institute for Risk Assessment (2021) and below the EFSA guidance value of 250 µg per day for the additional intake from supplements and fortified foods. Neither figure is a legal limit; binding European maximum levels for vitamins and minerals in food supplements have to this day not been set.

Which chromium compound is used for this, and why chromium yeast plays a special role in absorption, is set out in Chromium forms: picolinate, chloride and yeast. The rest of the trace element range is in the category Minerals, all chromium products in the category Chromium.
For chromium, two health claims are authorised, and in exactly this wording: Chromium contributes to normal macronutrient metabolism. Chromium contributes to the maintenance of normal blood glucose levels. (Regulation (EU) No 432/2012). The condition is a significant amount of 15 % of the nutrient reference value per daily portion, that is 6 µg. Food supplements are not a substitute for a balanced and varied diet and a healthy lifestyle.
Frequently asked questions
Which food contains the most chromium? Per 100 g it is spices, cocoa and confectionery. Related to a real portion the picture shifts: cocoa powder and chocolate stay in front, followed by bread, meat, brassica vegetables and oat flakes at 4 to 12 µg — differences that are smaller than the scatter of the measurements themselves.
Is wholegrain a better chromium source than white flour? In the European data this advantage is not visible: wheat bread lies higher than multigrain and rye bread. What does stand out clearly is oats among the milling products. Since part of the chromium measured can come from processing, no purchasing rule should be derived from such rankings.
Why do American tables show higher values for broccoli? Because they rest on older analyses produced with different methods and different sample preparation. The EFSA collection with 4,647 vegetable samples arrives at 28–37 µg/kg for brassica vegetables; that is about a tenth of what some portion figures suggest.
Do I need to target chromium through my diet? The measured intakes in Germany and Europe lie within the range of the estimated value of 30 to 100 µg per day, without anyone selecting food deliberately. A broad undersupply is not apparent in the consumption data — in the German National Nutrition Survey II, chromium was not even recorded. What an authorised chromium statement on a pack actually covers, and what it does not, is set out in Chromium and blood sugar: what the claim covers.
Sources: EFSA CONTAM Panel, Scientific Opinion on the risks to public health related to the presence of chromium in food and drinking water, EFSA Journal 2014;12(3):3595 — Table 6 (mean values by food group, LB/UB), Appendix E (individual values per food), Section 4.1 (limits of quantification 0.23–90 µg/kg; French and British total diet studies, kitchen and milling equipment as a chromium source), Section 6.1 (contributions of the food groups to intake); EFSA NDA Panel, Scientific Opinion on Dietary Reference Values for chromium, EFSA Journal 2014;12(10):3845 (intake medians from 26 surveys in 17 countries; food sources); German Federal Institute for Risk Assessment, proposed maximum levels for chromium in foods including food supplements (2021) — D-A-CH estimated values, German duplicate studies (Anke et al. 1998), 60 µg per recommended daily portion, EFSA guidance value 250 µg/day; German Nutrition Society (DGE), reference values for nutrient intake (chromium); Regulation (EU) No 432/2012 (authorised claims, official wording); Regulation (EU) No 1169/2011, Annex XIII (nutrient reference value 40 µg, significant amount 15 %); composition and recommended use according to the label of the product mentioned.